
Testing the Sediment Organic Contents Required for Biogenic Gas Hydrate Formation: Insights from Synthetic 3-D Basin and Hydrocarbon System Modelling
School of Earth, Energy & Environmental Sciences, Stanford University, Stanford, CA 94305, USA
*
Author to whom correspondence should be addressed.
Fuels 2022, 3(3), 555-562; https://doi.org/10.3390/fuels3030033
Submission received: 20 June 2022
/
Revised: 15 August 2022
/
Accepted: 5 September 2022
/
Published: 9 September 2022
Abstract
:Gas hydrates comprise one of the largest reservoirs of organic carbon on Earth. Marine gas hydrate predominantly consists of biogenic (i.e., microbially generated) methane molecules trapped within lattice-like cages of frozen water molecules. Sedimentary organic matter is the feedstock for methanogens producing gas in anaerobic sub-seafloor environments. Therefore, an understanding of the minimum amount of organic material (measured as carbon and hydrogen content) necessary for methanogenesis to result in appreciable volumes of hydrocarbons is central to understanding the requirements for gas hydrate formation. Reactive transport modelling by workers over the past 20 years suggests minimum requirements of ~0.3–0.5. wt. % TOC (total organic carbon) for gas hydrate formation, while earlier workers predicted TOC as low as ~0.1–0.2. wt. % could produce biogenic gas. However, the hydrogen content (recognized as the limiting reagent in hydrocarbon generation for over 50 years) needed for biogenic gas generation and gas hydrate formation is poorly understood. Furthermore, the minimum organic contents needed for gas hydrate formation have not been investigated via basin-scale computational modeling. Here, we construct a synthetic 3-D basin and gas hydrate system model to investigate minimum sediment TOC and hydrogen (HI, hydrogen index) contents needed for gas hydrate formation. Our modelling suggests that, under geologically favorable conditions, TOC as low as 0.1. wt. % (paired with 100 HI) and HI as low as 50 (paired with 0.2. wt. % TOC) may produce biogenic gas hydrate saturations above 1%. Our modelling demonstrates the importance of basin-scale investigation of hydrocarbon systems and demonstrates how the confluence of favorable structural controls (e.g., faults, folds, anticlines) and stratigraphic controls (e.g., carrier beds, reservoirs) can result in gas hydrate accumulations, even in organic-poor settings.
1. Introduction
Gas hydrate represents a potential global resource base that likely rivals in size all known organic carbon sources and exceeds the size of all known fossil fuel reserves [1,2]. Gas hydrate, therefore, has significant implications for both the global carbon cycle and its influence on oceanographic and climatic change, as well as for global energy access and energy security in an era of rising energy demand, development, and changing climate. However, the scientific understanding of gas hydrate formation and the engineering capabilities to successfully produce gas hydrate resources remain notable challenges [2].
Promisingly, recent advances in computational modeling allow these scientific and engineering challenges to be addressed. Namely, basin and petroleum system modeling (BPSM) allows for the comprehensive simulation of biogenic gas generation and the complex processes of gas migration and accumulation in the form of gas hydrate at the scale of potentially structurally complex marine sedimentary basins and fluid systems, through geologic time (e.g., [3,4,5]). The ability of BPSM to predict both volumetrics associated with gas hydrate as well as in-place gas hydrate saturations represents a significant advancement in the understanding of and ability to model gas hydrate systems [4].
BPSM relies on a number of inputs governing the stability of gas hydrate when modeling such systems, namely, basin or model geometries as well as boundary conditions that influence prevailing pressure and temperature conditions [4]. In addition to gas hydrate stability (which indicates whether the appropriate pressure and temperature conditions are present for the hypothetical stability of gas hydrate), BPSM models gas hydrate volumetrics and saturations associated with zones of predicted gas hydrate stability. That is, BPSM addresses two questions related to gas hydrate: (1) whether gas hydrate might be stable and, if so, (2) how much gas hydrate is predicted to be present. While basin model geometries and boundary conditions are critical to the first of these questions, an understanding of hydrocarbon (gas) generation, migration, and accumulation in gas hydrate deposits is critical to the second of these questions. Underlying the issue of gas generation, which is ultimately critical to the amount of gas hydrate able to accumulate in any given deposit, is the issue of whether sufficient organic matter has accumulated and has been preserved in order for methanogenesis and other gas-forming microbial reactions to progress in shallow marine sediments [6].
Understanding of the sediment organic properties (organic matter content and richness) of shallow marine sediments is critical to understanding the formation of gas hydrate [7,8,9], yet comprehensive study of the primary sediment organic properties (namely, total organic carbon—TOC, and hydrogen index—HI) associated with known gas hydrate localities is lacking and is, therefore, the focus of a separate work, described in [10]. Not only is this type of comprehensive study or survey lacking, but theoretical modeling harnessing varying sediment organic properties (including query of minimum threshold values) to test the formation and accumulation of gas hydrate is also lacking. This need for a modeling-based test of sediment organic properties associated with and needed for the occurrence of gas hydrate occurrence represents the focus of this study.
Here, we construct a synthetic 3-D geological model to test how variations in sediment organic properties (TOC and HI) influence the formation and accumulation of gas hydrate. We use these simplified models to assess what minimum values of organic content and richness (TOC and HI) are needed to result in the formation of gas hydrate under favorable geologic conditions. In a brief companion piece to the present work, we discuss how previously published BPSM studies have treated sediment organic properties in the context of modeling gas hydrate systems [11].
2. Synthetic Model Parameters
The PetroModTM v.2019 3-D model described here represents a simple, geologically plausible synthetic model, constructed to specifically assess the influence of variable sediment organic properties (TOC and HI) on the generation and accumulation of gas hydrates under favorable stratigraphic and structural conditions. Due to the high sensitivity of gas hydrates to pressure and temperature conditions (e.g., [12]), model parameters influencing these conditions must be controlled (i.e., held constant) in order to isolate the effects of sediment organic properties on gas hydrate formation. In this regard, the most influential model parameters are basin geometry, water depth, sediment–water interface temperature, and heat flow. We therefore utilize a set synthetic basin geometry constructed in layer-cake fashion, along with constant values for key boundary conditions.
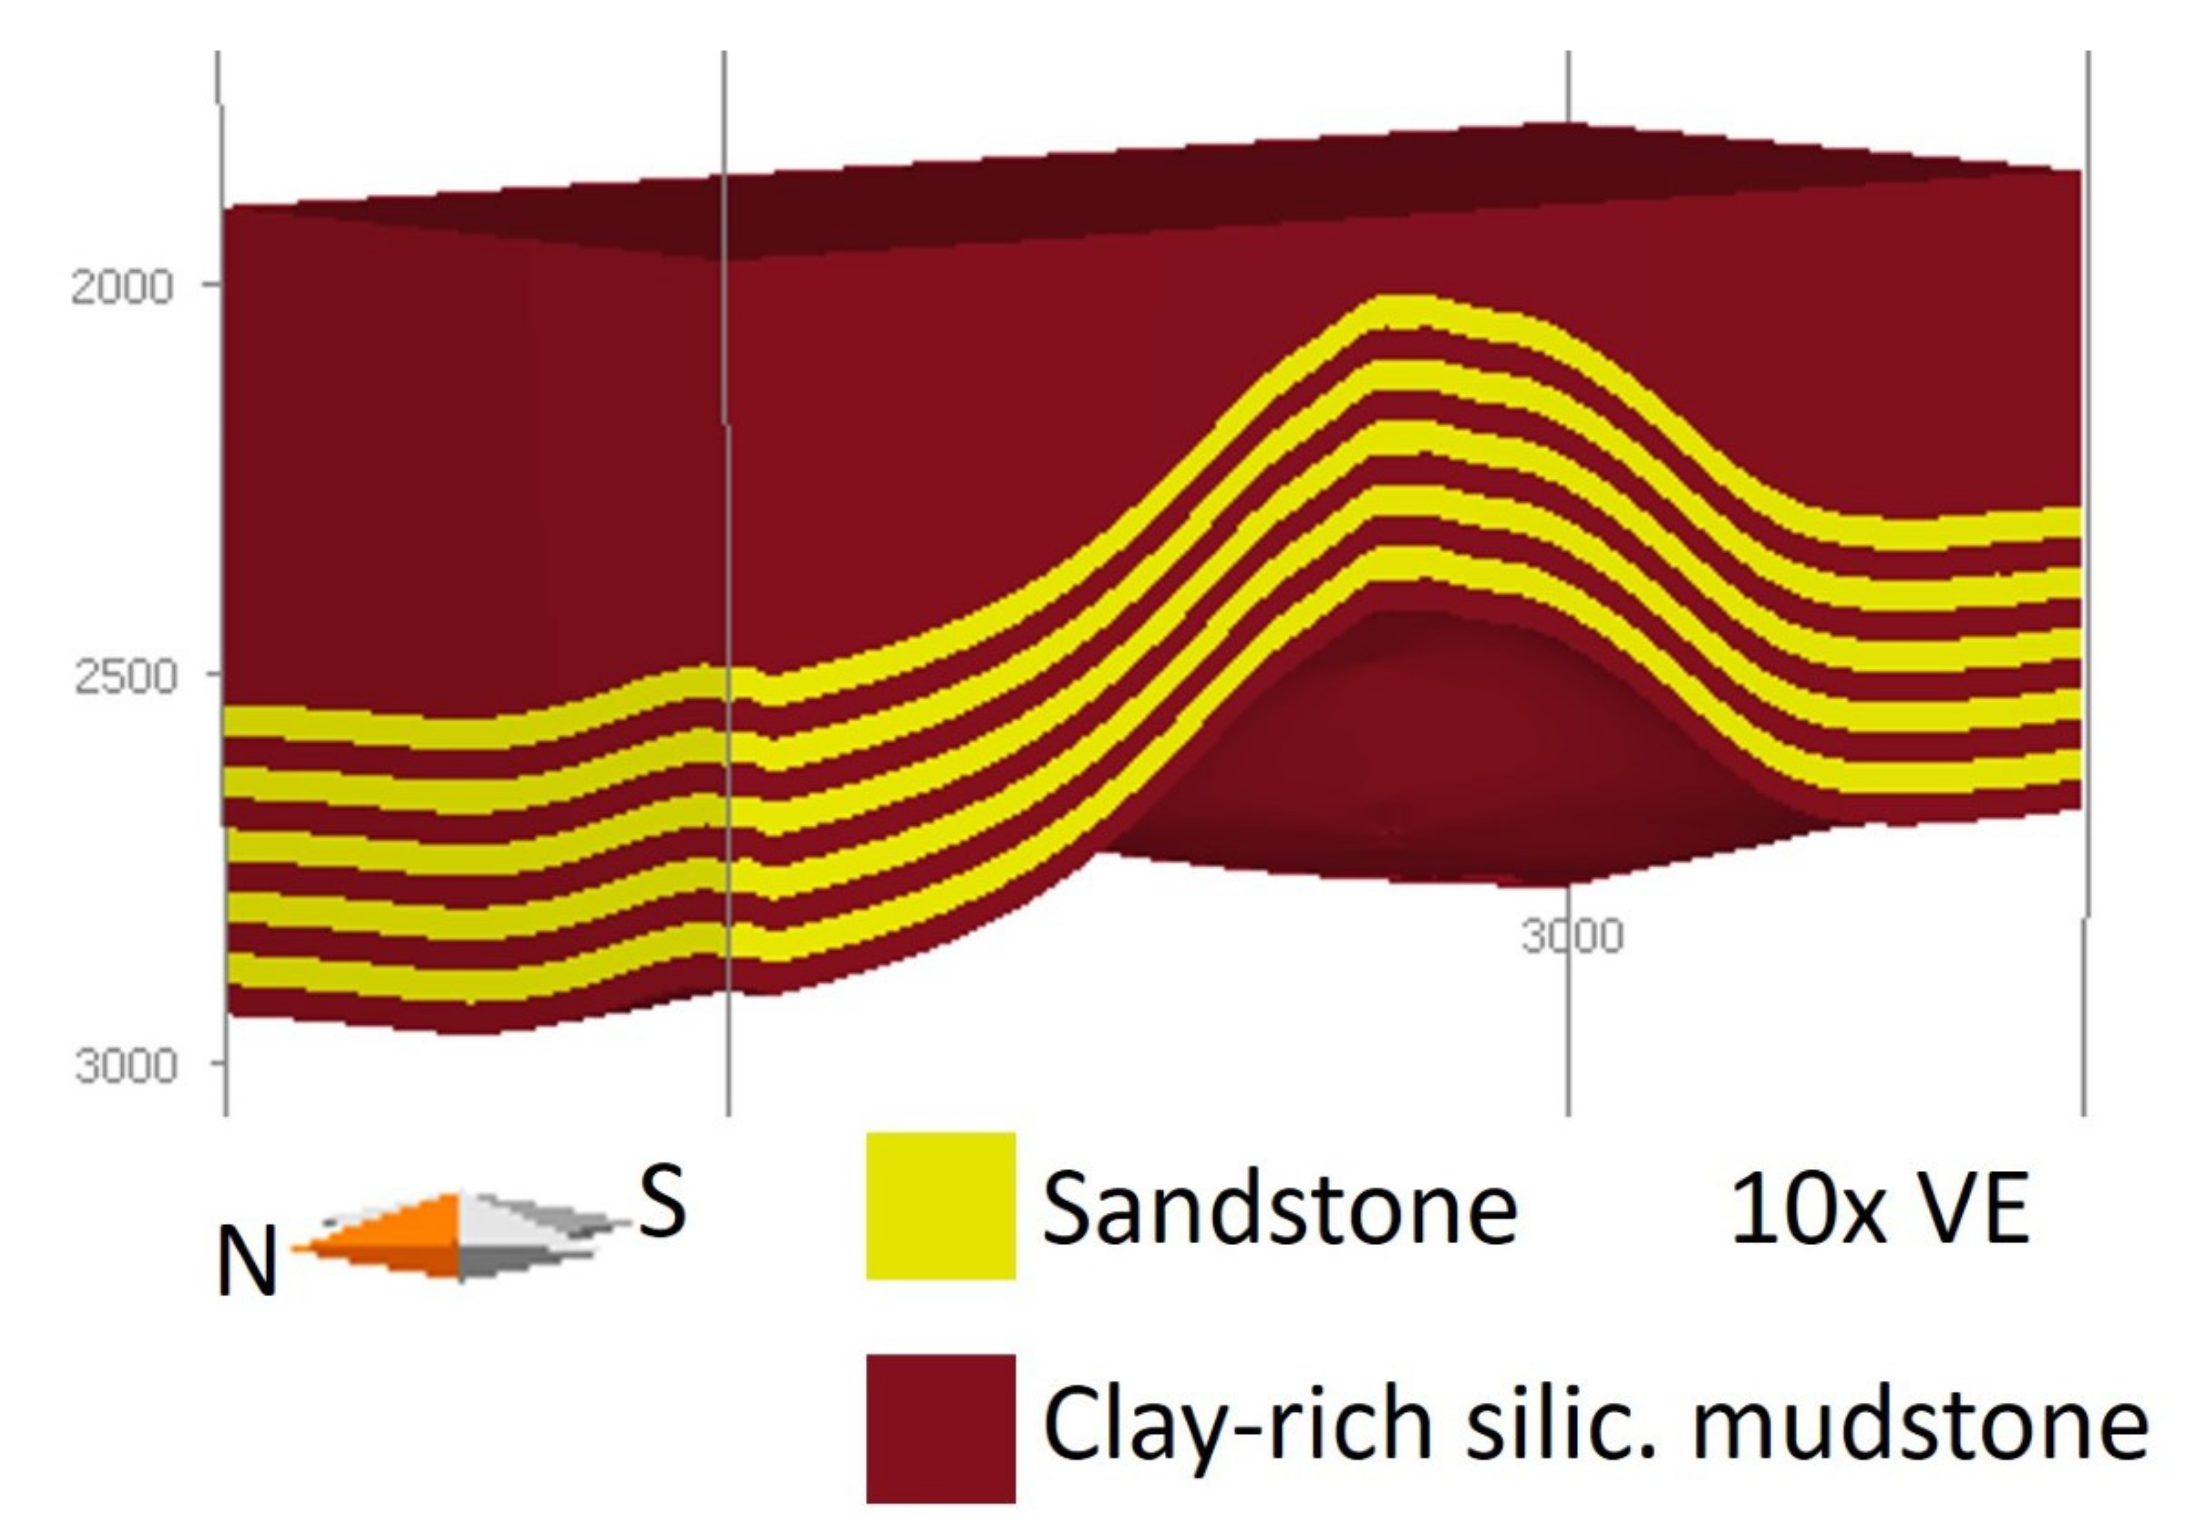
The 3-D model is 14 km wide and is defined by a horizontal resolution of 42 cells, each 35 m wide. The model contains 15 layers, spanning 800 m of sediment at its greatest thickness (Figure 1). The basal layers are folded in an anticlinal feature, ~7.5 km in diameter and with ~300 m of relief (Figure 2). These layers are cut by a fault plane that is treated as open to the flow of hydrocarbons. The average sedimentation rate was held constant at 400 m per million years. The lithologies of these basal layers are represented by default lithologies and parameters, as defined by PetroModTM. These basal layers are characterized by interbedded clean sand and silty-clay lithologies (silty clay used as in [4]), as might be found in a turbidite depositional system. We use Athy’s Law of compaction to simulate any sediment compaction that may have occurred [13]. The sediment overlying the anticline is assigned a uniform silty-clay lithology, in an effort to simulate general hemipelagic marine deposition.
The silty-clay lithology is treated as the site (or “source rock”) of potential biogenic gas generation in this model. Critical source rock organic properties are the values for total organic carbon (TOC) and hydrogen index (HI), which ultimately dictate the extent of gas generation in accordance with pre-defined kinetics. Hydrogen index here represents the amount of hydrogen relative to the amount of organic carbon present. In order to test the theoretical lower limits for the generation of biogenic gas and the resultant formation of gas hydrate, we vary values of TOC and HI used in this model, starting with the lowest test values of 0.1% TOC and 50 HI and varying both TOC and HI for multiple scenarios (Table 1).
Within the shallow sediments modeled here, generation of microbial methane within the organic-rich shale lithologies is simulated using Middelburg kinetics [14,15], which calculates the organic matter degradation rate as a function of TOC at each time step since initial sediment deposition. This degradation of organic matter at low temperature provides the means for microbial generation of methane that may contribute to the formation of gas hydrate.
Migration of biogenic gas is simulated using a combination of Darcy and flowpath migration (referred to as the Hybrid method in PetroModTM) to characterize gas migration in both higher and lower permeability units [16,17]. PetroModTM also calls for assignment of critical gas saturation values or the saturation at which the gas phase becomes mobile. Here, a relatively low critical saturation of 1 vol. % is assigned for gas, so as to encourage gas migration potential and to allow small gas bubble sizes to migrate (as in [18]).
The modeling effort described here also harnesses default gas hydrate phase properties (i.e., pressure, volume, and temperature conditions), as defined in PetroModTM, in accordance with properties established in the gas hydrate literature [19]. These include a gas hydrate density of 940 kg/m3, thermal conductivity of 0.49 W/m/K, heat capacity of 0.50 kcal/kg/K, and dissociation energy of 54.5 kcal/mol. Properties of pressure and temperature are used in conjunction with salinity of the pore water (set at 35‰ in accordance with average seawater salinity, e.g., [20]) by PetroModTM in order to calculate gas hydrate stability and solubility. These calculations use equations established by Tishchenko et al. [21], who also provided the theoretical framework whereby the formation and disassociation of gas hydrate is modeled in PetroModTM. Accordingly, formation of gas hydrate occurs when the concentration of dissolved methane exceeds solubility within the gas hydrate stability zone and disassociation occurs whenever the solubility of methane falls below saturation [21]. We assign a minimum gas saturation needed for gas hydrate formation of 1%, in accordance with the PetroModTM default value.
As mentioned above, model boundary conditions are held constant through time. The seafloor is held constant at a water depth of 1900 m, in accordance with the median water depth at global drilling sites where gas hydrate has been recovered (or where its presence has been strongly inferred) [10]. The sediment–water interface temperature, or temperature at the seafloor, is held constant at 4 °C. Heat flow throughout the model is held constant at 50 mW/m2, in accordance with heat flows consistent with the convergent margin settings that commonly host gas hydrate [22].
Ultimately, the BPSM process utilized by PetroModTM is here employed to assess both gas flux into the gas hydrate stability zone as well as in situ gas generation within the gas hydrate stability zone—as a consequence of variations in sediment organic properties—in order to assess gas hydrate formation under favorable stratigraphic and structural conditions.
3. Results and Discussion
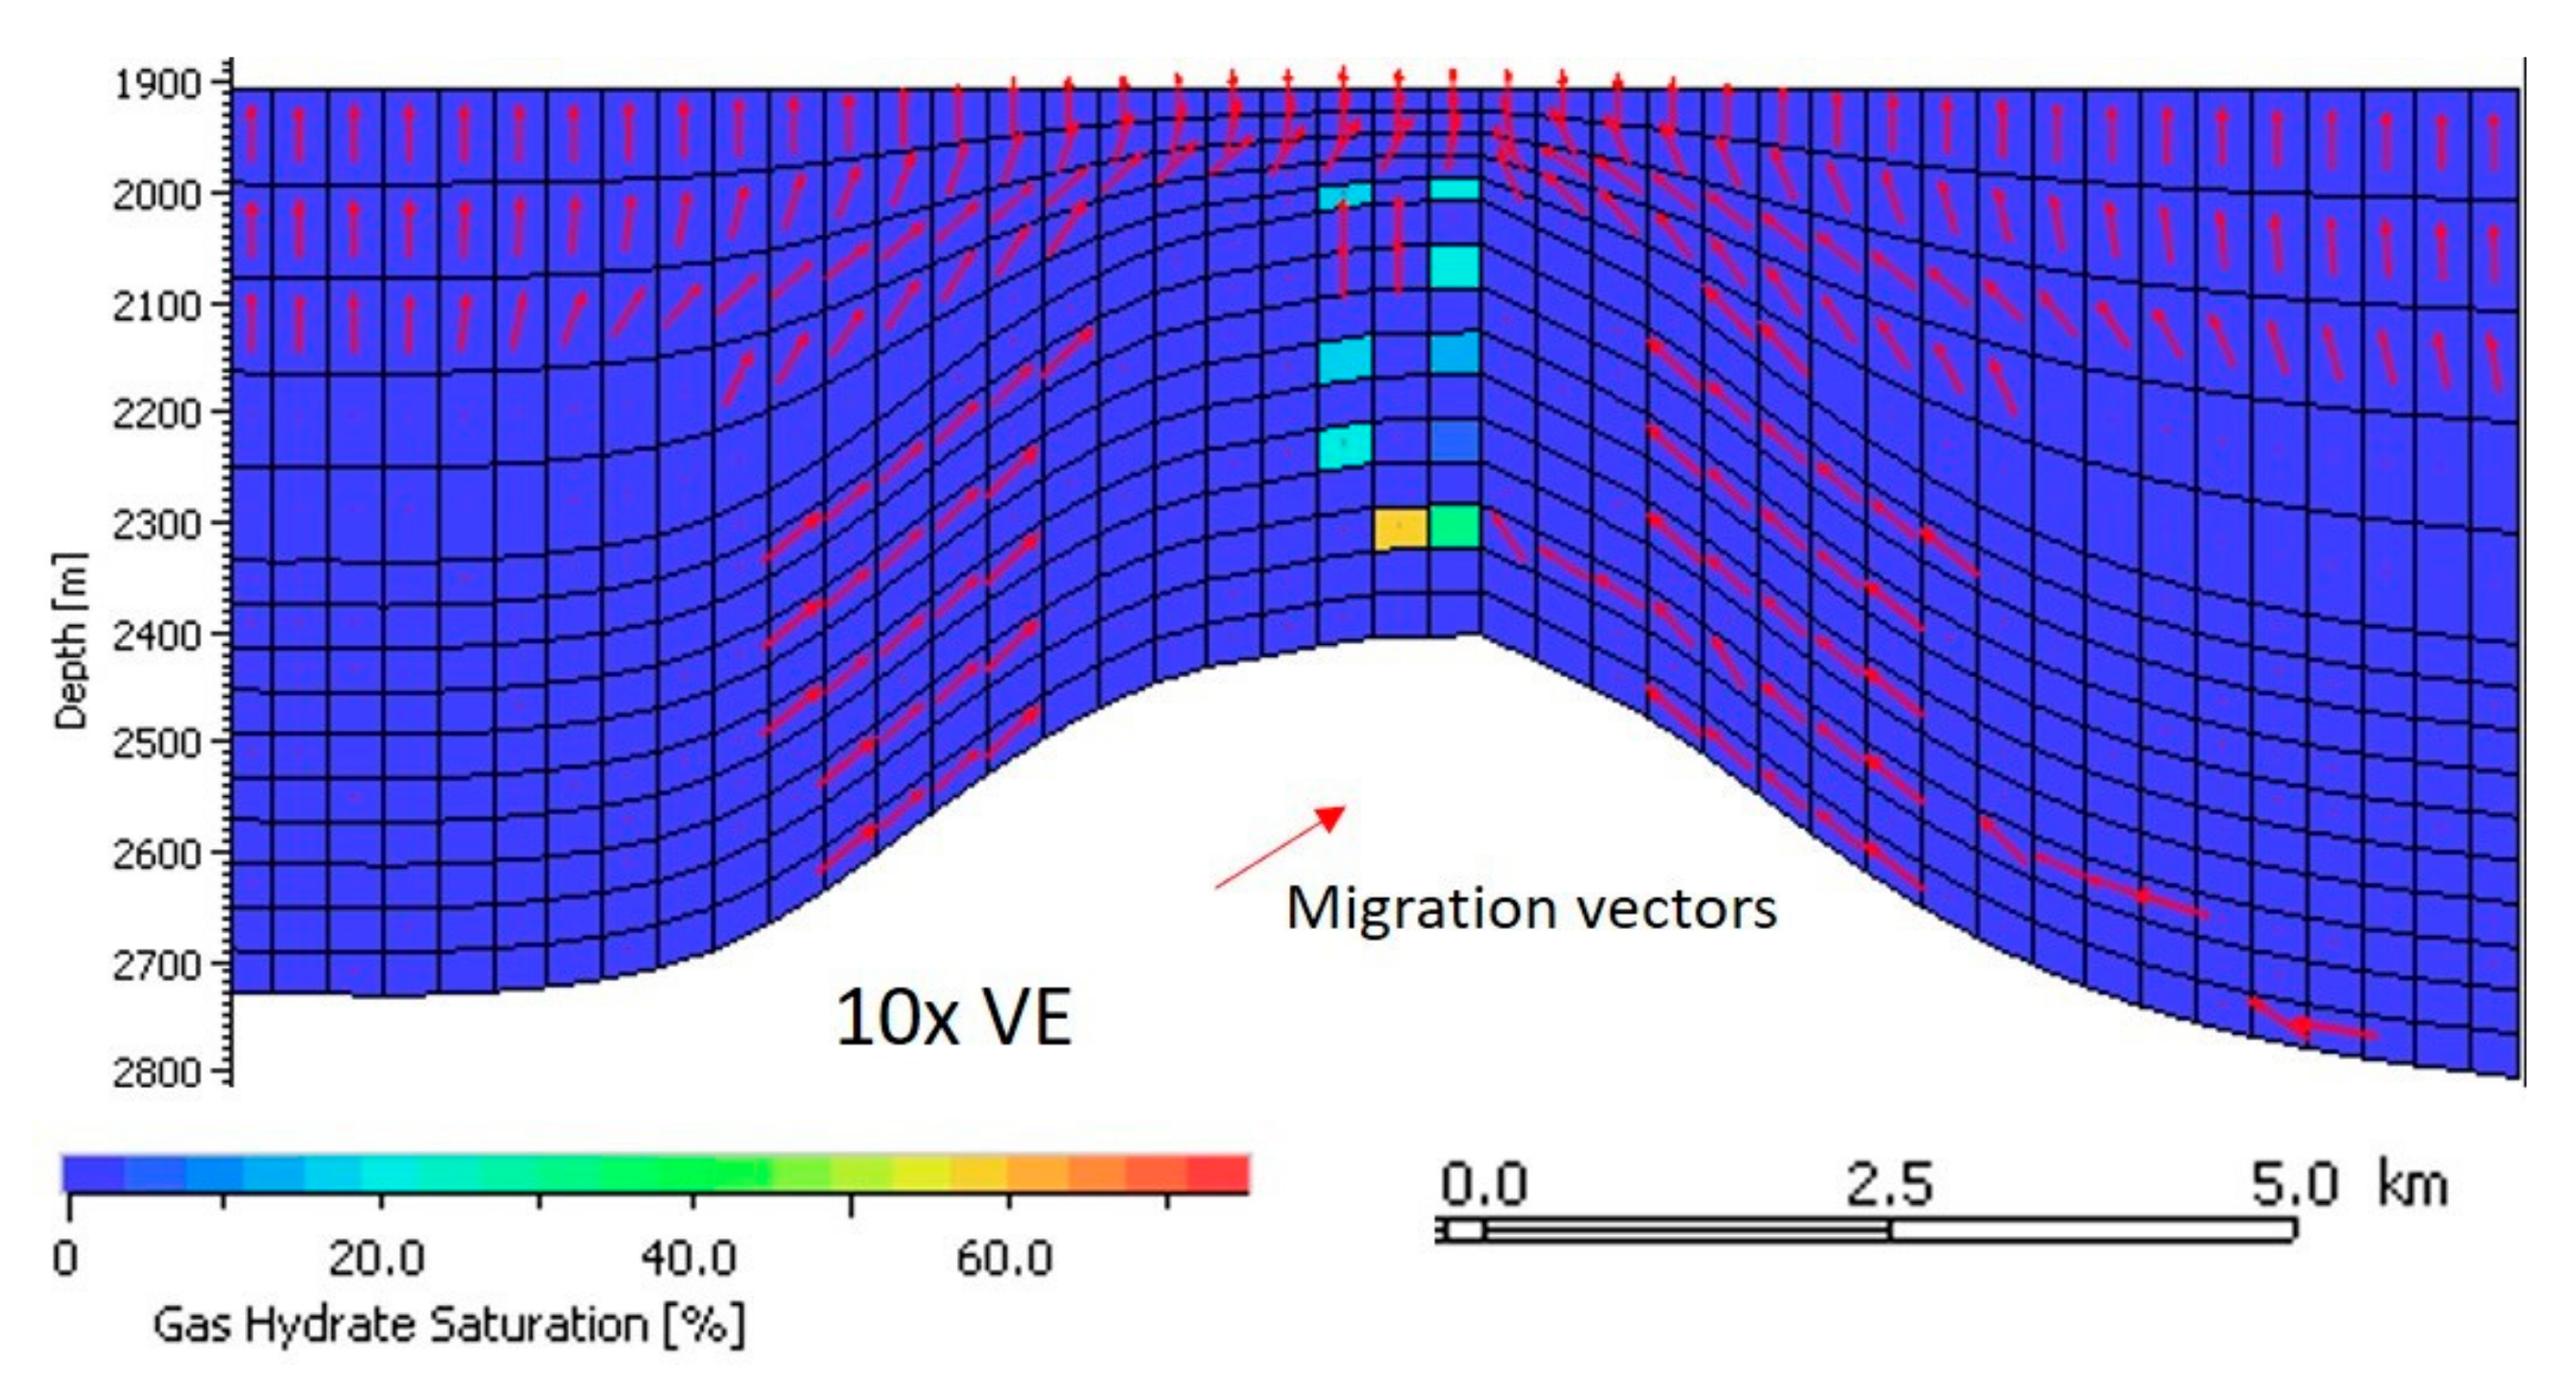
Model results demonstrate that gas hydrate saturations in excess of 1% form for both 0.1 wt. % TOC, 100 HI and 0.2 wt. % TOC, 50 HI scenarios (Figure 3 and Figure 4). Under the 0.1 wt. %, 100 HI scenario, for example, modeled gas hydrate occurs at saturations in excess of 50% (Figure 3 and Figure 4). Gas hydrate saturations do not form under the 0.1 wt. % TOC, 50 HI scenario. Thus, our models present a simple demonstration of the minimum sediment organic contents needed for the generation of biogenic gas and for the accumulation of this gas in the form of gas hydrate. We discuss these minimum required values in the context of previously published studies at greater length below.
As expected, gas migration within the anticlinal folds of the model is directed toward the apex of the anticline (Figure 3). Somewhat counterintuitively, migration as well as accumulation of gas hydrate saturations is concentrated within the silty-clay (rather than clean sand) lithologies. We interpret this to be due to the higher relative porosities within the silty-clay lithologies, because the silty-clay lithologies have not yet fully compacted during burial. At greater burial depths, the silty-clay lithologies would compact further than the sand, and the clean sand lithologies would maintain higher porosities and therefore form more favorable reservoirs for hydrocarbon accumulation (e.g., as in traditional petroleum systems [23]).
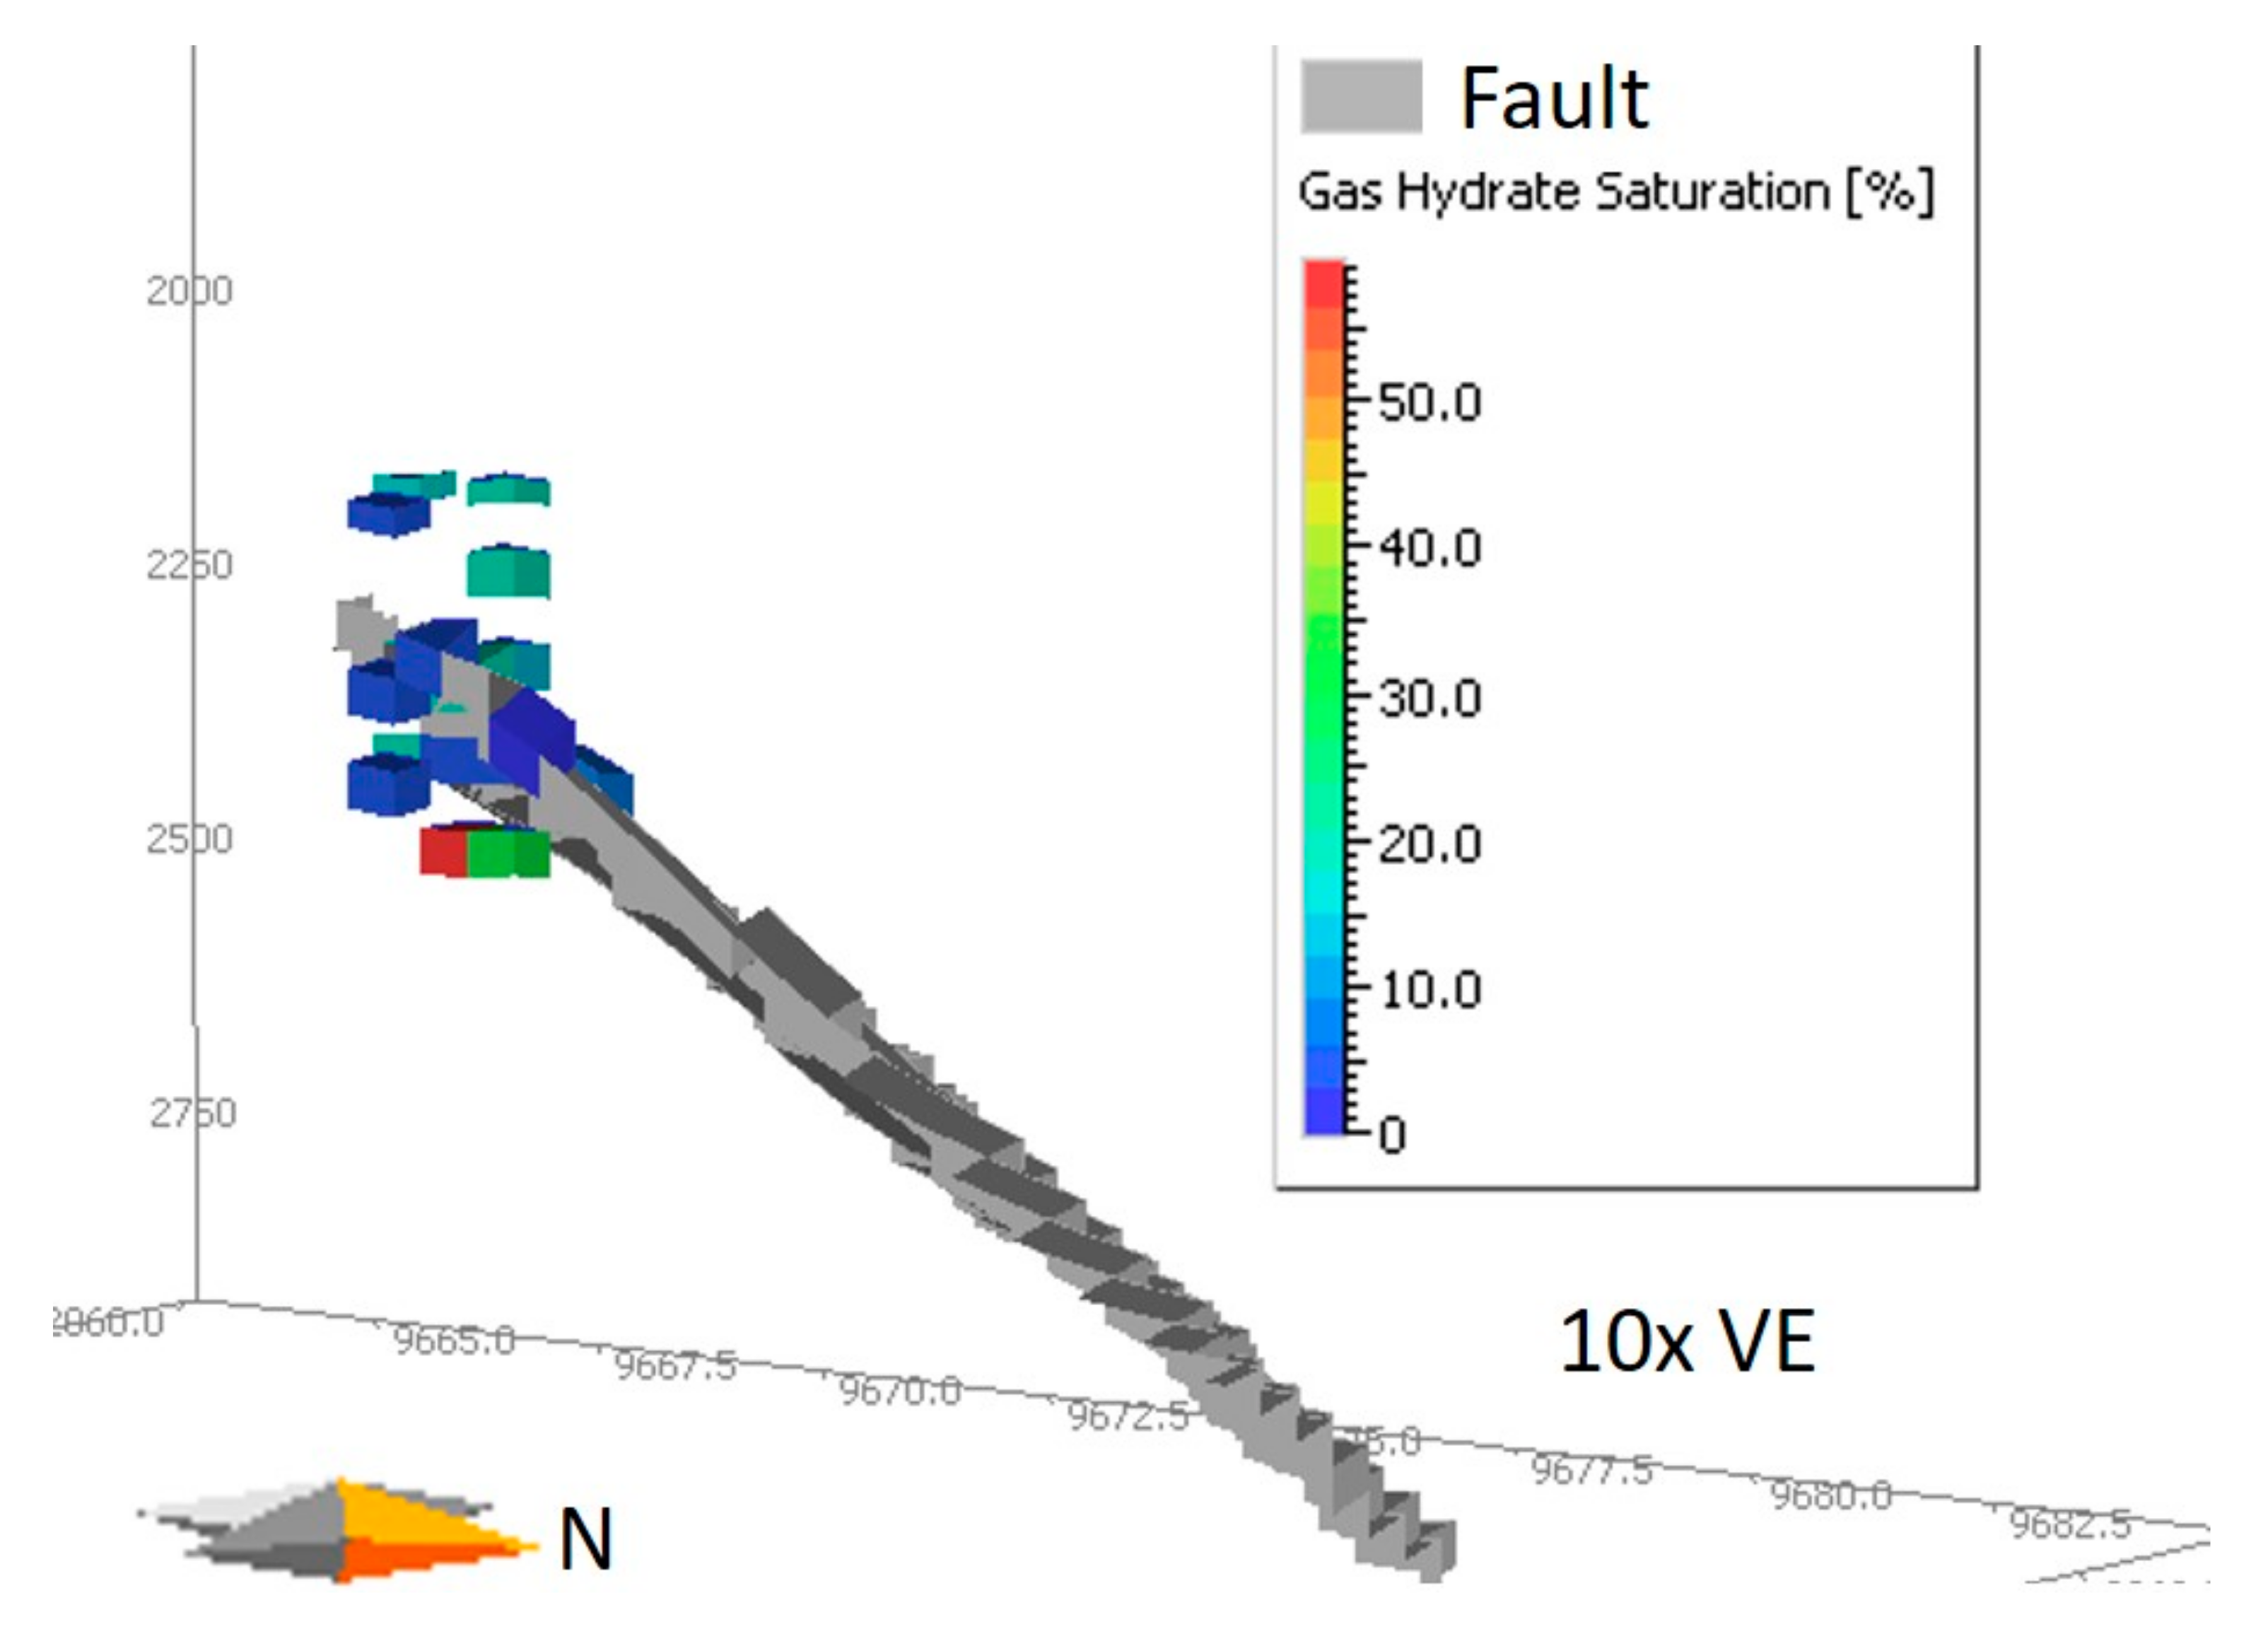
Alongside this demonstration of gas migration along porous silty-clay layers and toward the apex of the anticlinal structure, our simple models demonstrate along-fault fluid focusing and migration of biogenic gas (Figure 4). Adjacent to the fault plane modeled here, gas saturations in excess of 50% occur and cells populated with gas hydrate seem to visually cluster around the top of the fault (Figure 4). This finding is consistent with previous work on the influence of folding and faulting on gas migration and gas hydrate formation and accumulation (e.g., [24,25]).
Contextualization of our synthetic model results within previous work on establishing the minimum organic contents for both biogenic gas generation and gas hydrate formation is important. Previous workers have suggested minimum TOC contents needed for gas hydrate formation range from ~0.3 wt. % TOC (reaction-transport modeling by Burwicz et al. [26]) and 0.4 wt. % (mass-transfer modeling by Klauda and Sandler [27]) to 0.5 wt. % (numerical calculations by Waseda [7]). The study by Burwicz et al. [26] suggests gas hydrate formation is controlled by a combination of sediment TOC and sedimentation rate and that this means the minimum TOC needed for gas hydrate formation ranges from ~0.3 to >1.0 wt. %. Our work predicts gas hydrate formation at TOC contents as low as 0.1 wt. %, which is lower than TOC contents estimated to be necessary for gas hydrate formation by these previous workers. We suggest that our study differentiates itself in that it takes a basin-scale approach to modeling gas hydrate formation and, therefore, demonstrates that factors such as favorable structural configurations (e.g., a fault allowing for the focused migration of gas; an anticlinal feature allowing for focused migration of gas) and favorable stratigraphic conditions can allow for the formation of gas hydrate under scenarios of organic matter contents that are more organic poor than previously predicted. This finding seems intuitive and is, at a coarse level, compatible with work by Clayton [28], who found that free gas can be generated under a TOC as low as 0.12 wt. % (i.e., a TOC compatible with our modelled minimum sediment organic content scenarios of 0.1 wt. % TOC, 100 HI and 0.2 wt. % TOC, 50 HI) in normally pressured sediments.
4. Concluding Remarks
We present simple hypothetical demonstrations of basin-scale biogenic gas generation and migration and accumulation of this gas in the form of gas hydrate. We demonstrate that, under geologically favorable scenarios (i.e., favorable structural and stratigraphic controls), appreciable gas hydrate saturations can form in otherwise organic-content-poor environments. Two such organic-content-poor scenarios (0.1 wt. % TOC, 100 HI and 0.2 wt. % TOC, 50 HI) are here shown to result in saturations of gas hydrate exceeding 50%. We wish to note that the above demonstrations are simple theoretical illustrations and must be matched with empirical observations from gas hydrate localities. Nonetheless, our work serves to demonstrate the importance of basin-scale investigation of complex geologic and fluid systems, such as gas hydrate.
Author Contributions
Conceptualization, Z.F.M.B.; methodology, Z.F.M.B. and L.N.D.; modeling and formal analysis, Z.F.M.B. and L.N.D.; writing—original draft preparation, Z.F.M.B.; writing—review and editing, Z.F.M.B. and L.N.D. All authors have read and agreed to the published version of the manuscript.
Funding
Z.F.M.B. and L.N.D. undertook the gas hydrate system modeling work described herein while supported as graduate student members of the Stanford University Basin Processes and Subsurface Modeling Industrial Affiliates Program and as appointees of the U.S. Department of Energy Postgraduate Research Program at the National Energy Technology Laboratory (administered by the Oak Ridge Institute for Science and Education).
Data Availability Statement
All model parameters (including synthetic data) used in this work are reported within the manuscript text.
Acknowledgments
We acknowledge Yongkoo Seol and Steve Graham for support as program advisors at the National Energy Technology Laboratory and Stanford University, respectively, and Allegra Hosford Scheirer as co-director of the Stanford Basin Processes and Subsurface Modeling (BPSM) Program. We thank Allegra, Yongkoo, Steve, Ken Peters, and Oliver Schenk for helpful discussions during the early course of this work and thank Victor Awosiji for assistance with model access. We acknowledge Schlumberger for providing the PetroModTM license to the Stanford BPSM Program and acknowledge the Sherlock High Performance Computing Cluster at Stanford University for providing computational facilities. We thank four anonymous reviewers for comments and suggestions that much improved the quality of this manuscript and Z.F.M.B. thanks the Fuels editor for the invitation to submit this article as a Feature Paper.
Conflicts of Interest
The authors declare no conflict of interest.
References
- Kvenvolden, K.A. A review of the geochemistry of methane in natural gas hydrate. Org. Geochem. 1995, 23, 997–1008. [Google Scholar] [CrossRef]
- Collett, T.; Bahk, J.J.; Baker, R.; Boswell, R.; Divins, D.; Frye, M.; Goldberg, D.; Husebø, J.; Koh, C.; Malone, M.; et al. Methane Hydrates in Nature–Current Knowledge and Challenges. J. Chem. Eng. Data 2015, 60, 319–329. [Google Scholar] [CrossRef]
- Kroeger, K.F.; Plaza-Faverola, A.; Barnes, P.M.; Pecher, I.A. Thermal evolution of the New Zealand Hikurangi subduction margin: Impact on natural gas generation and methane hydrate formation–A model study. Mar. Pet. Geol. 2015, 63, 97–114. [Google Scholar] [CrossRef]
- Piñero, E.; Hensen, C.; Haeckel, M.; Rottke, W.; Fuchs, T.; Wallmann, K. 3-D numerical modelling of methane hydrate accumulations using PetroMod. Mar. Pet. Geol. 2016, 71, 288–295. [Google Scholar] [CrossRef]
- Burton, Z.F.M.; Kroeger, K.F.; Hosford Scheirer, A.; Seol, Y.; Burgreen-Chan, B.; Graham, S.A. Tectonic uplift destabilizes subsea gas hydrate: A model example from Hikurangi Margin, New Zealand. Geophys. Res. Lett. 2020, 47, e2020GL087150. [Google Scholar] [CrossRef]
- Rice, D.D.; Claypool, G.E. Generation, accumulation, and resource potential of biogenic gas. AAPG Bull. 1981, 65, 5–25. [Google Scholar]
- Waseda, A. Organic carbon content, bacterial methanogenesis, and accumulation processes of gas hydrates in marine sediments. Geochem. J. 1998, 32, 143–157. [Google Scholar] [CrossRef]
- Wallmann, K.; Pinero, E.; Burwicz, E.; Haeckel, M.; Hensen, C.; Dale, A.; Ruepke, L. The global inventory of methane hydrate in marine sediments: A theoretical approach. Energies 2012, 5, 2449–2498. [Google Scholar] [CrossRef]
- Johnson, J.E.; Phillips, S.C.; Torres, M.E.; Piñero, E.; Rose, K.K.; Giosan, L. Influence of total organic carbon deposition on the inventory of gas hydrate in the Indian continental margins. Mar. Pet. Geol. 2014, 58, 406–424. [Google Scholar] [CrossRef]
- Burton, Z.F.M. Characterizing Oil, Gas Hydrate, and Sedimentary Systems via Geochemistry, Computational Modeling, and Global Synthesis. Ph.D. Thesis, Stanford University, Stanford, CA, USA, 2020. [Google Scholar]
- Burton, Z.F.M. Sediment Organic Contents Required for Gas Hydrate Formation: A Survey of Published Basin and Hydrocarbon System Models. Minerals 2022, submitted.
- Xu, W.; Ruppel, C. Predicting the occurrence, distribution, and evolution of methane gas hydrate in porous marine sediments. J. Geophys. Res. 1999, 104, 5081–5095. [Google Scholar] [CrossRef]
- Athy, L.F. Density, porosity, and compaction of sedimentary rocks. AAPG Bull. 1930, 14, 1–24. [Google Scholar]
- Middelburg, J.J. A simple rate model for organic matter decomposition in marine sediments. Geochim. Et Cosmochim. Acta 1989, 53, 1577–1581. [Google Scholar] [CrossRef]
- Wallmann, K.; Aloisi, G.; Haeckel, M.; Obzhirov, A.; Pavlova, G.; Tishchenko, P. Kinetics of organic matter degradation, microbial methane generation, and gas hydrate formation in anoxic marine sediments. Geochim. Cosmochim. Acta 2006, 70, 3905–3927. [Google Scholar] [CrossRef]
- Hantschel, T.; Kauerauf, A.I. Fundamentals of Basin and Petroleum Systems Modeling; Springer Science & Business Media: Berlin/Heidelberg, Germany, 2009. [Google Scholar]
- Baur, F.; Katz, B. Some practical guidance for petroleum migration modeling. Mar. Pet. Geol. 2018, 93, 409–421. [Google Scholar] [CrossRef]
- Burwicz, E.; Reichel, T.; Wallmann, K.; Rottke, W.; Haeckel, M.; Hensen, C. 3-D basin-scale reconstruction of natural gas hydrate system of the Green Canyon, Gulf of Mexico. Geochem. Geophys. Geosystems 2017, 18, 1959–1985. [Google Scholar] [CrossRef]
- Sloan, E.D., Jr.; Koh, C.A. Clathrate Hydrates of Natural Gases, 3rd ed.; CRC Press: Boca Raton, FL, USA, 2007; p. 752. [Google Scholar]
- Lyman, J.; Fleming, R.H. Composition of sea water. J. Mar. Res. 1940, 3, 134–146. [Google Scholar]
- Tishchenko, P.; Hensen, C.; Wallmann, K.; Wong, C.S. Calculation of the stability and solubility of methane hydrate in seawater. Chem. Geol. 2005, 219, 37–52. [Google Scholar] [CrossRef]
- Allen, P.A.; Allen, J.R. Basin Analysis: Principles and Application to Petroleum Play Assessment; John Wiley & Sons: Hoboken, NJ, USA, 2013. [Google Scholar]
- Magoon, L.B.; Dow, W.G. The petroleum system. In The Petroleum System—From Source to Trap; AAPG Memoir 60; Magoon, L.B., Dow, W.G., Eds.; American Association of Petroleum Geologists: Tulsa, OK, USA, 1994; pp. 3–24. [Google Scholar]
- Barnes, P.M.; Lamarche, G.; Bialas, J.; Henrys, S.; Pecher, I.; Netzeband, G.L.; Greinert, J.; Mountjoy, J.J.; Pedley, K.; Crutchley, G. Tectonic and geological framework for gas hydrates and cold seeps on the Hikurangi subduction margin, New Zealand. Mar. Geol. 2010, 272, 26–48. [Google Scholar] [CrossRef]
- Crutchley, G.J.; Kroeger, K.F.; Pecher, I.A.; Gorman, A.R. How tectonic folding influences gas hydrate formation: New Zealand’s Hikurangi subduction margin. Geology 2019, 47, 39–42. [Google Scholar] [CrossRef]
- Burwicz, E.B.; Rüpke, L.H.; Wallmann, K. Estimation of the global amount of submarine gas hydrates formed via microbial methane formation based on numerical reaction-transport modeling and a novel parameterization of Holocene sedimentation. Geochim. Cosmochim. Acta 2011, 75, 4562–4576. [Google Scholar] [CrossRef]
- Klauda, J.B.; Sandler, S.I. Global distribution of methane hydrate in ocean sediment. Energy Fuels 2005, 19, 459–470. [Google Scholar] [CrossRef]
- Clayton, C. Source volumetrics of biogenic gas generation. In Bacterial Gas; Vially, R., Ed.; Editions Technip: Paris, France, 1992; pp. 191–204. [Google Scholar]
Figure 1.
Stratigraphy of our 3-D model (interbedded mudstone and clays within the anticlinal dome feature, draped by a thick layer of clay-rich mudstone). Note 10× vertical exaggeration.
Figure 1.
Stratigraphy of our 3-D model (interbedded mudstone and clays within the anticlinal dome feature, draped by a thick layer of clay-rich mudstone). Note 10× vertical exaggeration.

Figure 2.
Structural features (anticlinal dome and fault plane) included within our 3-D synthetic model to create “geologically favorable” factors for the migration and accumulation of gas. Note 10× vertical exaggeration.
Figure 2.
Structural features (anticlinal dome and fault plane) included within our 3-D synthetic model to create “geologically favorable” factors for the migration and accumulation of gas. Note 10× vertical exaggeration.

Figure 3.
Two-dimensional cross-section view of modeled gas migration (red arrows) and gas hydrate formation (colored cells) under the 0.1 wt. % TOC, 100 HI scenario. Note 10× vertical exaggeration.
Figure 3.
Two-dimensional cross-section view of modeled gas migration (red arrows) and gas hydrate formation (colored cells) under the 0.1 wt. % TOC, 100 HI scenario. Note 10× vertical exaggeration.

Figure 4.
Three-dimensional view of model cells with greater than 1% gas hydrate saturation (blue, green, and red cells) and of the fault plane (grey cells). Scenario shown is for 0.1 wt. % TOC, 100 HI. Note 10× vertical exaggeration.
Figure 4.
Three-dimensional view of model cells with greater than 1% gas hydrate saturation (blue, green, and red cells) and of the fault plane (grey cells). Scenario shown is for 0.1 wt. % TOC, 100 HI. Note 10× vertical exaggeration.


Table 1.
Subset of the TOC/HI scenarios tested via our 3-D synthetic modelling, including indication of whether or not these scenarios resulted in gas hydrate formation.
Table 1.
Subset of the TOC/HI scenarios tested via our 3-D synthetic modelling, including indication of whether or not these scenarios resulted in gas hydrate formation.
| Scenario | TOC | HI | Gas Hydrate Formed? |
|---|---|---|---|
| 1 | 0.1 wt. % | 50 | No |
| 2 | 0.1 wt. % | 100 | Yes |
| 3 | 0.2 wt. % | 50 | Yes |
| 4 | 0.2 wt. % | 100 | Yes |
| 5 | 0.3 wt. % | 50 | Yes |
| 6 | 0.3 wt. % | 100 | Yes |
Publisher’s Note: MDPI stays neutral with regard to jurisdictional claims in published maps and institutional affiliations. |
© 2022 by the authors. Licensee MDPI, Basel, Switzerland. This article is an open access article distributed under the terms and conditions of the Creative Commons Attribution (CC BY) license (https://creativecommons.org/licenses/by/4.0/).
Share and Cite
MDPI and ACS Style
Burton, Z.F.M.; Dafov, L.N. Testing the Sediment Organic Contents Required for Biogenic Gas Hydrate Formation: Insights from Synthetic 3-D Basin and Hydrocarbon System Modelling. Fuels 2022, 3, 555-562. https://doi.org/10.3390/fuels3030033
AMA Style
Burton ZFM, Dafov LN. Testing the Sediment Organic Contents Required for Biogenic Gas Hydrate Formation: Insights from Synthetic 3-D Basin and Hydrocarbon System Modelling. Fuels. 2022; 3(3):555-562. https://doi.org/10.3390/fuels3030033
Chicago/Turabian StyleBurton, Zachary F. M., and Laura N. Dafov. 2022. "Testing the Sediment Organic Contents Required for Biogenic Gas Hydrate Formation: Insights from Synthetic 3-D Basin and Hydrocarbon System Modelling" Fuels 3, no. 3: 555-562. https://doi.org/10.3390/fuels3030033