
Sediment Organic Contents Required for Gas Hydrate Formation: A Survey of Published Basin and Hydrocarbon System Models
Department of Geological Sciences, Stanford University, Stanford, CA 94305, USA
Fuels 2022, 3(4), 580-587; https://doi.org/10.3390/fuels3040035
Submission received: 4 July 2022
/
Revised: 22 August 2022
/
Accepted: 22 September 2022
/
Published: 30 September 2022
Abstract
:Recent advances in basin and petroleum system modelling have allowed for the investigation of gas hydrate systems, including modelling of the generation, migration, and accumulation of biogenic and thermogenic gas within gas hydrate deposits. In this brief survey paper, the treatment of sediment organic properties (organic content and richness, expressed as total organic carbon and the hydrogen index) within previously published basin and petroleum system models of marine gas hydrate systems is reviewed. Eight studies (published between 2015 and 2020) are described and discussed. This review contributes to the state of knowledge in the field by reviewing existing modelling studies of gas hydrates and concludes with brief takeaways on important considerations and knowledge gaps in the state of basin and hydrocarbon system modelling of gas hydrate systems.
1. Introduction
Basin and petroleum system (BPSM) modelling allows for the reconstruction of basin histories and for the reconstruction of petroleum system (including gas hydrate system) evolution [1]. In BPSM, measurements or estimations of total organic carbon (TOC) and of hydrogen (expressed as the hydrogen index, HI) are critical in assessing the generative potential of sediments or rock (i.e., how much oil and gas these sediments or rock could produce) [1]. BPSM of gas hydrates uses TOC and HI values of shallow sediments in assessing the biogenic generation of gas, and the resultant accumulation of such gas as free gas phases and/or as gas hydrate.
PetroMod™ is a comprehensive BPSM software suite that has recently been used to model the biogenic generation of gas and the formation of gas hydrate (e.g., [2,3]). The first published PetroMod™ model of gas hydrate formation modelled both shallow biogenic and deeper biogenic (as well as deep thermogenic) methane generation [2]. This study demonstrated the influence of TOC on gas hydrate formation due to its influence on biogenic gas generation (specifically, a doubling of TOC from 0.5 to 1 wt.% in sediments responsible for biogenic generation resulted in modelled hydrate saturations that were on average ~78% higher in that study) [2]. A paper dedicated to demonstrating the PetroMod™ gas hydrate module describes the module as a collection of algorithms developed to both capture the physical, thermodynamic, and kinetic properties of gas hydrates and to capture (via a built-in kinetic model) the biogenic degradation of TOC and the resultant formation of methane for incorporation into gas hydrate [3].
Here, a brief survey of the treatment of sedimentary organic matter (as TOC and HI) in existing studies that have utilized the PetroMod™ gas hydrates module for the BPSM of gas hydrates is conducted. This work serves as a short companion paper to our BPSM modelling-based query of sediment organic requirements for the formation of gas hydrate, published in the same volume [4]. It is important to note that none of the studies surveyed here focus specifically on the minimum sediment organic contents required for biogenic gas generation and formation of gas hydrate. Our companion paper [4] does present a modelling-based approach to the question of the minimum sediment organic contents required for the formation of gas hydrate, and in my previous work, I present a global inventory of sediment organic contents associated with gas hydrate locations as an empirical approach to the question of sediment organic contents requisite to hydrate formation [5]. This paper therefore focuses exclusively on how past workers have treated TOC and HI in the modelling of gas hydrate systems.
2. Surveyed Studies
Eight BPSM studies published between 2015 and 2020 [2,3,6,7,8,9,10,11] include TOC and/or HI data (Table 1). Of these eight studies, three focus on BPSM of New Zealand’s Hikurangi margin [2,8,10], one focuses on New Zealand’s Taranaki Basin [9], one focuses on the Nankai Trough [6], one focuses on the Gulf of Mexico [7], one focuses on South China Sea’s Pearl River Mouth Basin [11], and one is a synthetic model [3] (Table 1; Figure 1).
Several BPSM studies of gas hydrate do not include the use of sedimentary organic contents (as TOC or HI): an extended abstract from 2013 focused on the Alaska North Slope [12], two studies from 2018, of the Black Sea [13] and South China Sea [14], and two studies from 2020, both on the Hikurangi margin of New Zealand [15,16] (Table 2; Figure 1).
3. Survey Results and Discussion
The sediment organic contents (TOC and HI) used in the eight studies surveyed are listed in Table 3.
The 2D BPSM model published by Kroeger et al. [2] was the first (aside from conference proceedings) to describe the use of PetroMod™’s capabilities for the modelling of gas hydrates. This model simulates both biogenic and thermogenic generation of gas, migration into the GHSZ, and formation of gas hydrates [2]. The study finds that biogenic gas generation is the primary contributor to predicted gas hydrate saturations, and that this generation peaks at a depth of ~1600 mbsf [2]. Kroeger et al. [2] utilize a conservative TOC estimate of 0.5 wt.%, as well as a TOC of 1 wt.%, for biogenic gas generation in the Miocene to Recent finer-grained sediments. A standard HI of 100 was used in accordance with general marine averages for the region (Kroeger, personal communication). The study assumed that microbial gas generation peaked at 37.5 °C (based on the 35 to 40 °C peak for microbial gas generation of [18]), and followed a Gaussian distribution [2]. Average predicted hydrate saturations are 0.9% for TOC of 0.5 wt.% and 1.6% for TOC of 1 wt.%, though it should be noted that saturations of up to 20 to 70% are predicted in accumulations influenced by structural and/or stratigraphic focusing of gas migration, and higher saturations are predicted at the base of the GHSZ [2]. It should also be noted that in the Miocene–Recent sediments, predicted masses of gas hydrate increase proportionally to the TOC contents [2]. The model was not found to reproduce any significant amount of contribution to gas hydrate formation via the shallowest gas generation (in the upper 200 m of sediment), rather, most of this gas was found to escape to the overlying water column [2].
Two models were published in early 2016, and cover 2D and 3D modelling of the Nankai Trough [6] and a theoretical 3D layer-cake model intended to demonstrate the PetroMod™ gas hydrates module [3].
The Nankai Trough study covers the Daini-Atsumi Knoll, which includes the site of the first offshore gas hydrate production test site [6]. As per previous carbon isotope work on retrieved gas hydrate core samples, the study assumes most gas here to be biogenically sourced, and therefore models microbial generation [6]. Fujii et al. [6] use a TOC of 0.5 wt.%, based on core analysis, and use a “base case” HI of 60 for 3-D modelling. Peak microbial gas generation is modelled with a peak at 12.5 °C for the 3-D model [6]. Based on sensitivity analysis using the 2D model, use of this lower peak generation temperature is found to result in a model that much better predicts the observed accumulations of gas hydrate, whereas higher peak temperatures fail to do so [6]. In general, the model parameters utilized are found to accurately predict the locations of observed gas hydrate accumulations [6]. The study notes that predicted gas hydrate saturations, some in excess of 30%, tend to correlate with sediment distribution (stratigraphic control) and formation dip direction (structural control) [6].
The theoretical model published by Piñero et al. [3] serves to demonstrate the use of the PetroMod™ gas hydrates module in simulating the distribution and temporal evolution of the GHSZ, the biogenic and thermogenic generation of gas, migration of generated gas, and the accumulation of this gas in gas hydrate deposits. The study uses a TOC of 2.5 wt.% and HI of 240 (based on what the study describes as the average for phytoplankton organic matter) and Middelburg kinetics for the biogenic generation of gas within 2.5 to 0 Ma sediments [3]. The theoretical study predicts nearly equal quantities of methane to have been generated via biogenic versus thermogenic processes, with slightly more thermogenic methane generated, while the methane hydrate itself is predicted to be composed of ~55% biogenic methane and ~45% thermogenic methane [3]. Importantly, most generated biogenic gas is predicted to escape to the overlying water column, though remaining gas forms gas hydrate in situ [3]. Predicted hydrate saturations range from 0 to 50–60% and tend to be a product of layer shape (structural control) and sediment properties (stratigraphic control) [3]. Faults are demonstrated to have significant effect on saturations, with saturations adjacent faults some 20 to 30% in excess of saturations further from faults [3].
Three gas hydrate BPSM models were published in 2017, two for areas in New Zealand [8,9], and one for the Gulf of Mexico’s Green Canyon [7]. Both 2017 New Zealand modelling studies are, like Kroeger et al. [2], from lead authors at GNS Science of New Zealand and cover similar marine settings as the 2015 contribution, and therefore utilize the same sediment organic properties as Kroeger et al. [2], namely, TOC contents of 0.5 wt.% and HI values of 100.
Like the 2015 contribution, Crutchley et al. [8] focus on the Hikurangi margin, though this study examines a submarine canyon located in the fold-and-thrust belt inboard of Pegasus Basin, rather than Pegasus Basin itself, which was the subject of Kroeger et al. [2]. As mentioned above, this study uses a TOC of 0.5 wt.% and HI of 100, as in Kroeger et al. [2], and also uses the same peak temperature of 35 to 40 °C for microbial gas generation. Through their 2D BPSM modeling effort, Crutchley et al. [8] find that free gas trapped under gas hydrate beneath a submarine canyon can be incorporated into the hydrate in response to canyon incision and a correspondent shifting of the base of the GHSZ. This process provides a canyon-mediated mechanism for locally increased gas hydrate saturations, with model results suggesting increases in saturation on the order of 15 to 25 wt.% directly above the base of the GHSZ beneath the incising submarine canyon [8]. The authors also note the influence of dipping layers (structural control) on gas migration and on local increases in gas hydrate saturation, as well as the influence of the sediment layer lithology (stratigraphic control) in encouraging layer-parallel gas migration [8].
Kroeger et al. [9] utilize 2D BPSM to illustrate gas hydrate formation along the shelf margin of New Zealand’s Taranaki Basin and find that modelling predicts primary gas sourcing for the formation of hydrates due to microbial gas generation within thick slope sediments and augmented by thermogenic gas generation from deep source rocks. As above, this study also uses a TOC of 0.5 wt.% and HI of 100, as in Kroeger et al. [2], and likewise uses the same peak temperature of 35 to 40 °C for microbial gas generation. This results in microbial gas generation concentrated between depths of 200 and 1200 mbsf, with peak generation at ~800 mbsf [9]. Rates of generation are found to be elevated with higher heating due to burial, meaning high Pleistocene sedimentation rates result in the highest predicted microbial generation, and thus, the highest gas hydrate concentrations, at the modern shelf edge and slope [9]. On the slope, a hydrate layer is predicted to occur in the down-dip wall of incised submarine canyons, and canyon incision is predicted to lead to a downward shift in the base of GHSZ, as in Crutchley et al. [8].
The Green Canyon 3-D BPSM study by Burwicz et al. [7] is a detailed examination of the formation and accumulation of gas hydrates observed in the area. Modelling predicts a predominance of biogenic gas hydrate, in accordance with previous work on the hydrates found here, and modelled distributions of gas hydrate match well with borehole observations [7]. The study utilizes a conservative TOC estimate of 0.7 wt.%, as well as a more realistic TOC estimate of 1 wt.%, and an HI of 100 (based on DSDP data) in modelling biogenic gas generation in Pliocene and Pleistocene sediments [7]. As in Piñero et al. [3], this study uses Middelburg kinetics to simulate the microbial generation of gas within these sediments [7]. Shallow gas found within the Pleistocene layers here is mostly sourced from in situ biogenic production, which is attributed to high sedimentation rates and high TOC contents [7]. Nearly 87% of all methane generated in the model is biogenically sourced, while some 13% is thermogenic [7]. Over 60% of total methane generated is predicted to be lost to the overlying water column, while a further 19% is lost through the sides of the model [7]. Nonetheless, appreciable quantities of gas hydrate are predicted presently, with local saturations reaching as high as 80% [7]. Highest saturations (greater than 50 to 60%) are found in depressions, i.e., topographic lows (structural control), and most gas hydrate in general is predicted to accumulate as a relatively continuous layer near the base of the GHSZ (around 500 mbsf), which is attributed to sandy sediment (stratigraphic control) at this depth, as well as methane gas recycling due to high Neogene sedimentation rates causing upward shifting of the base of the GHSZ [7]. Saturations are markedly lower, reaching a high of 5 to 8%, in the uppermost Pleistocene layers (300 to 500 mbsf) above the base of the GHSZ, which is attributed to low gas flux from underlying sediments and the drastically reduced porosities created by gas hydrate at the base of the GHSZ [7]. In general, the study notes that both the presence of gas hydrates as well as saturations on the order of 20 to 80% have been confirmed by drilling during the Join Industry Project (JIP) Leg II campaign [7].
As with Kroeger et al. [2] and Crutchley et al. [8], the contribution by Kroeger et al. [10] focuses on the Hikurangi margin, though in this recent study the authors expand upon the 2D transect modelled by Kroeger et al. [2] and create a full 3D model covering the extent of the Pegasus Basin. This model uses the same organic property values (0.5 wt.% and 1 wt.% TOC) as Kroeger et al. [2] for biogenic gas generation in Neogene sediments under three different model scenarios, and also varies organic properties used for thermogenic gas generation under these same scenarios [10]. When using peak microbial activity and methane generation centered around 37 °C (as in [2,8,9]), the model predicts peak microbial gas generation at 1300 m below the seafloor (which is shallower than in Kroeger et al. [2] due to a higher heat flow used in the 2019 model), whereas when using Middelburg kinetics (as in [3,7]), the model predicts peak microbial gas generation in the uppermost 200 m of sediment [10]. Relative contributions of biogenic versus thermogenic gas generation are found to vary—as might be expected—depending on the respective organic properties assigned to rocks and sediments in the modelled biogenic and thermogenic systems [10]. For instance, the scenarios using a TOC of 1 wt.% for Neogene sediment biogenic gas generation predict twice as much microbial gas generation as the scenario that uses a TOC of 0.5 wt.% for these sediments [10].
Two further papers from GNS scientists, published in 2020 and 2022 [16,17], follow similar approaches to the 2015 paper by GNS authors [2] in their treatment of gas generation modelling, and therefore are not discussed in detail within this survey.
A 2D modelling study of the Pearl River Mouth Basin was published in [11]. The study uses two TOC content scenarios, 0.5 wt.% and 1 wt.%, in simulating biogenic gas generation. It is unclear what HI is used in modelling the biogenic reaction. The authors state that biogenic gas generation temperatures range from 35 °C to 75 °C within the study area, and therefore assume that biogenic gas generation follows a Gaussian distribution with a peak value of 55 °C. The authors use the two TOC scenarios to compare predicted saturations with seismic inversion-based prediction of gas hydrate occurrence in the study area (as well as with core sample TOC measurements) and find that a 0.5 wt.% TOC scenario fits these observations more closely. The study predicts that biogenic gas generation is distributed within the sediment from 1500 mbsf to the seafloor and that thermogenic gas generation occurs between 2300 mbsf and 6000 mbsf, and overall predicts that thermogenic gas (rather than biogenic) is the primary contributor to gas hydrate in the study area.
4. Concluding Remarks
- (A)
- Sediment organic contents are important: organic matter content and richness exert control on the volumes of liquid and gaseous hydrocarbons generated (which ultimately impacts gas hydrate formation).
- (B)
- Geology is important: both stratigraphic and structural controls on gas migration and accumulation are noted within the surveyed studies. These geologic controls impact gas migration and accumulation, which ultimately influence gas hydrate formation.
- (C)
- Basin-scale (and system-scale) investigation is important: gas does not generate, migrate, and accumulate in one dimension (i.e., in the traditional view of a single well or borehole). Gas and gas hydrate systems are dynamic, operating in three dimensions, through time.
- (D)
- Kinetics for biogenic gas-forming reactions are poorly defined and often left open to interpretation at the discretion of authors within the surveyed studies. Improved biogenic gas kinetics are necessary to better understand and predict gas hydrate formation.
- (E)
- Calibration matters: testing multiple scenarios for organic contents in a study area (as well as multiple scenarios for any parameter in the broader basin and hydrocarbon system, e.g., heat flow, lithology, sediment–water interface temperature, rock properties) can yield a better fit between model predictions and observations.
- (F)
- The distribution of studies harnessing basin and hydrocarbon system modelling of gas hydrate systems is limited (Figure 1), and overall, relatively few studies have used basin and petroleum systems modelling-based approaches to investigate gas hydrate systems. This invites much-expanded investigation of gas hydrate systems in additional locations and additional geological contexts.
Funding
Z.F.M.B. undertook much of the review work herein while a graduate student member of the then-named Stanford University Basin and Petroleum System Modeling (BPSM) Industrial Affiliates Program and as an appointee of the U.S. Department of Energy Postgraduate Research Program at the National Energy Technology Laboratory (administered by the Oak Ridge Institute for Science and Education). Additional support to Z.F.M.B. was provided by the Gordon Research Conference Carl Storm Fellowship and the Stanford Shell Foundation Grant Fund.
Data Availability Statement
All data discussed in this work are reported within the manuscript text, tables, and figures.
Acknowledgments
I would like to acknowledge Allegra Hosford Scheirer for support as co-director of the Stanford BPSM Program, and Yongkoo Seol and Steve Graham for support as program advisors at the National Energy Technology Laboratory and Stanford University, respectively. I would like to thank Allegra, Yongkoo, Steve, Ken Peters, Seth Haines, and Tim Collett for helpful discussions during the early course of this work. I would like to thank two anonymous reviewers for helpful comments and suggestions that much improved the quality of this manuscript.
Conflicts of Interest
The author declares no conflict of interest.
References
- Hantschel, T.; Kauerauf, A.I. Fundamentals of Basin and Petroleum Systems Modeling; Springer Science & Business Media: Berlin/Heidelberg, Germany, 2009. [Google Scholar]
- Kroeger, K.F.; Plaza-Faverola, A.; Barnes, P.M.; Pecher, I.A. Thermal evolution of the New Zealand Hikurangi subduction margin: Impact on natural gas generation and methane hydrate formation–A model study. Mar. Pet. Geol. 2015, 63, 97–114. [Google Scholar] [CrossRef]
- Piñero, E.; Hensen, C.; Haeckel, M.; Rottke, W.; Fuchs, T.; Wallmann, K. 3-D numerical modelling of methane hydrate accumulations using PetroMod. Mar. Pet. Geol. 2016, 71, 288–295. [Google Scholar] [CrossRef]
- Burton, Z.F.M.; Dafov, L.N. Testing the sediment organic contents required for biogenic gas hydrate formation: Insights from synthetic 3-D basin and hydrocarbon system modelling. Minerals 2022, 3, 555–562. [Google Scholar] [CrossRef]
- Burton, Z.F.M. Characterizing Oil, Gas Hydrate, and Sedimentary Systems via Geochemistry, Computational Modeling, and Global Synthesis. Ph.D. Thesis, Stanford University, Stanford, CA, USA, 2020. [Google Scholar]
- Fujii, T.; Tin Aung, T.; Wada, N.; Komatsu, Y.; Suzuki, K.; Ukita, T.; Wygrala, B.; Fuchs, T.; Rottke, W.; Egawa, K. Modeling gas hydrate petroleum systems of the Pleistocene turbiditic sedimentary sequences of the Daini-Atsumi area, eastern Nankai Trough, Japan. Interpretation 2016, 4, SA95–SA111. [Google Scholar] [CrossRef]
- Burwicz, E.; Reichel, T.; Wallmann, K.; Rottke, W.; Haeckel, M.; Hensen, C. 3-D basin-scale reconstruction of natural gas hydrate system of the Green Canyon, Gulf of Mexico. Geochem. Geophys. Geosyst. 2017, 18, 1959–1985. [Google Scholar] [CrossRef]
- Crutchley, G.J.; Kroeger, K.F.; Pecher, I.A.; Mountjoy, J.J.; Gorman, A.R. Gas hydrate formation amid submarine canyon incision: Investigations from New Zealand’s Hikurangi subduction margin. Geochem. Geophys. Geosyst. 2017, 18, 4299–4316. [Google Scholar] [CrossRef]
- Kroeger, K.F.; Crutchley, G.J.; Hill, M.G.; Pecher, I.A. Potential for gas hydrate formation at the northwest New Zealand shelf margin—New insights from seismic reflection data and petroleum systems modelling. Mar. Pet. Geol. 2017, 83, 215–230. [Google Scholar] [CrossRef]
- Kroeger, K.F.; Crutchley, G.J.; Kellett, R.; Barnes, P.M. A 3-D Model of Gas Generation, Migration, and Gas Hydrate Formation at a Young Convergent Margin (Hikurangi Margin, New Zealand). Geochem. Geophys. Geosyst. 2019, 20, 5126–5147. [Google Scholar] [CrossRef]
- Sun, L.; Wang, X.; He, M.; Jin, J.; Li, J.; Yuanping, L.; Zhu, Z.; Zhang, G. Thermogenic gas controls high saturation gas hydrate distribution in the Pearl River Mouth Basin: Evidence from numerical modeling and seismic anomalies. Ore Geol. Rev. 2020, 127, 103846. [Google Scholar] [CrossRef]
- Haeckel, M.; Pińero, E.; Rottke, W.; Fuchs, T.; Hensen, C.; Wallmann, K. 3-D Numerical Modelling of Gas Hydrate Accumulations at the Alaska North Slope. In Proceedings of the 75th EAGE Conference & Exhibition-Workshops, European Association of Geoscientists & Engineers, London, UK, 10–13 June 2013. [Google Scholar]
- Hillman, J.I.; Burwicz, E.; Zander, T.; Bialas, J.; Klaucke, I.; Feldman, H.; Drexler, T.; Awwiller, D. Investigating a gas hydrate system in apparent disequilibrium in the Danube Fan, Black Sea. Earth Planet. Sci. Lett. 2018, 502, 1–11. [Google Scholar] [CrossRef]
- Su, P.; Liang, J.; Peng, J.; Zhang, W.; Xu, J. Petroleum systems modeling on gas hydrate of the first experimental exploitation region in the Shenhu area, northern South China sea. J. Asian Earth Sci. 2018, 168, 57–76. [Google Scholar] [CrossRef]
- Burton, Z.F.M.; Kroeger, K.F.; Hosford Scheirer, A.; Seol, Y.; Burgreen-Chan, B.; Graham, S.A. Tectonic uplift destabilizes subsea gas hydrate: A model example from Hikurangi Margin, New Zealand. Geophys. Res. Lett. 2020, 47, e2020GL087150. [Google Scholar] [CrossRef]
- Hillman, J.I.; Crutchley, G.J.; Kroeger, K.F. Investigating the role of faults in fluid migration and gas hydrate formation along the southern Hikurangi Margin, New Zealand. Mar. Geophys. Res. 2020, 41, 1–19. [Google Scholar] [CrossRef]
- Kroeger, K.F.; Crutchley, G.J.; Hillman, J.I.; Turco, F.; Barnes, P.M. Gas hydrate formation beneath thrust ridges: A test of concepts using 3D modelling at the southern Hikurangi Margin, New Zealand. Mar. Pet. Geol. 2022, 135, 105394. [Google Scholar] [CrossRef]
- Katz, B.J. Microbial processes and natural gas accumulations. Open Geol. J. 2011, 5, 75–83. [Google Scholar] [CrossRef] [Green Version]
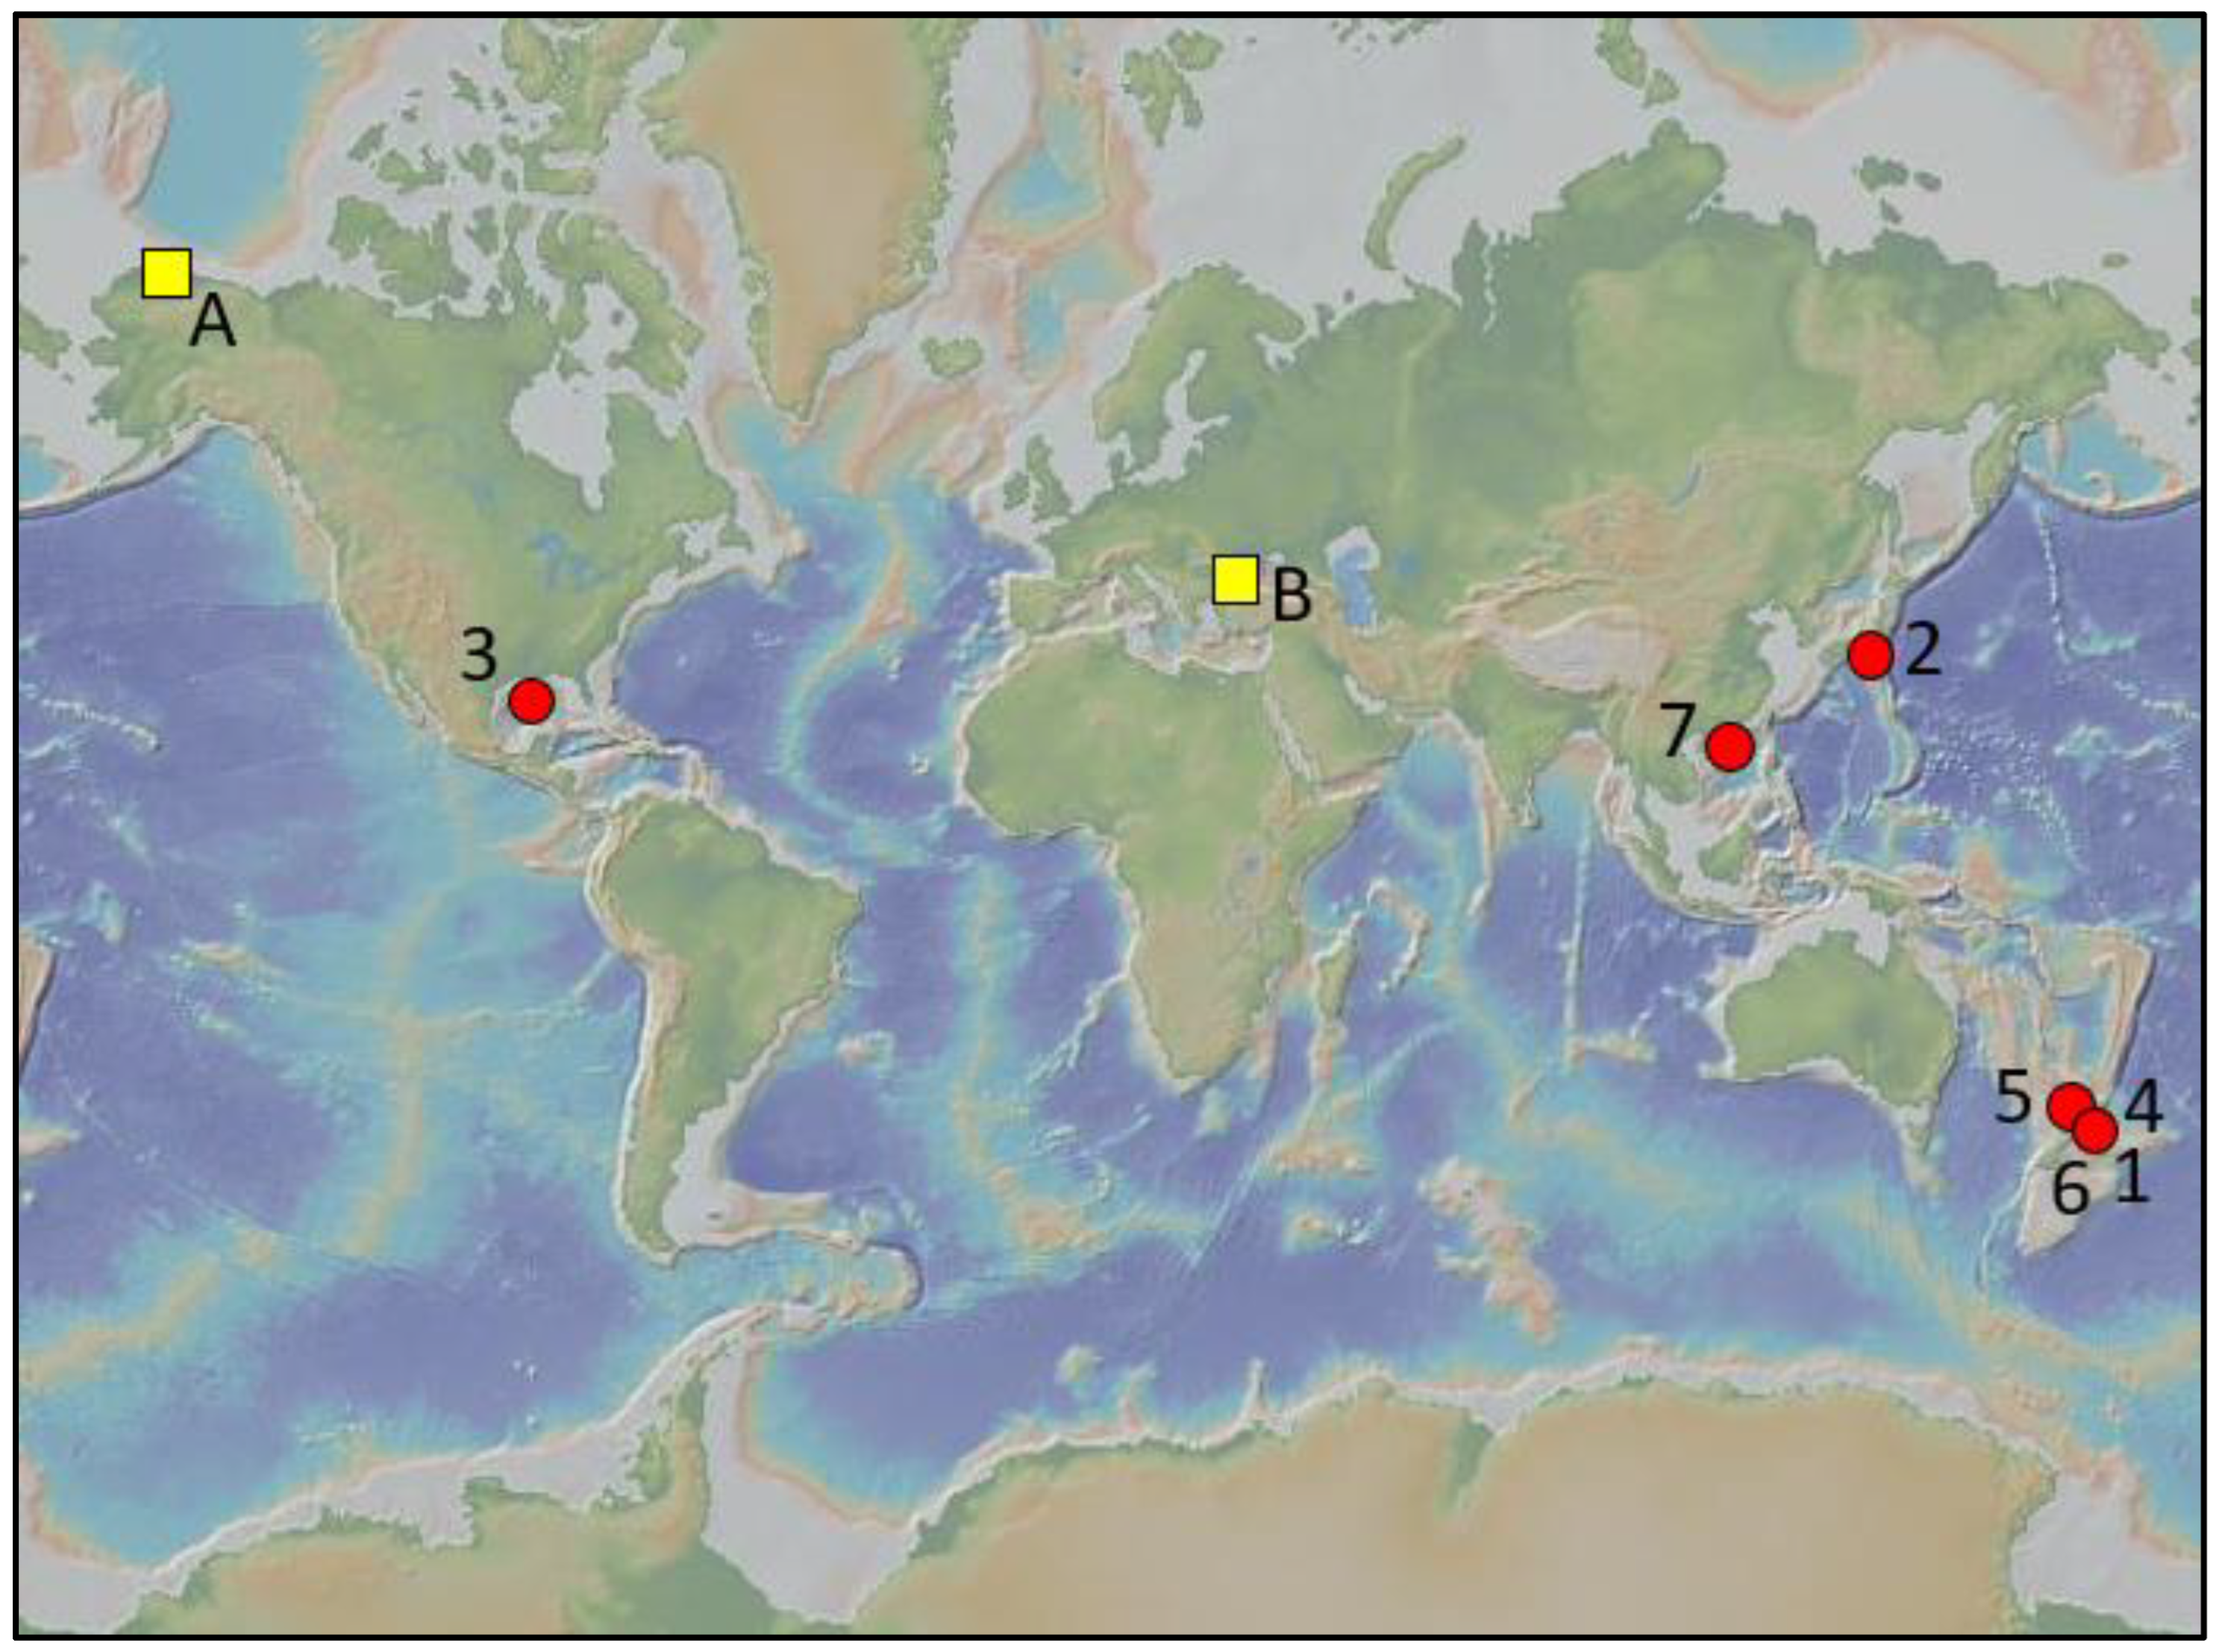
Figure 1.
Study area locations for the surveyed gas hydrate modelling studies. Red circle indicates study with published TOC and HI values; yellow square indicates study that did not use or publish TOC and HI values. Numbering and lettering correspond to locations in Table 1 and Table 2 (note that Table 2 Pearl River Mouth Basin and Hikurangi margin locations are not included in lettering for sake of visual clarity). Base map is from GeoMapApp v.2019.


Table 1.
Basic metadata of the modelling studies surveyed that use TOC and/or HI values.
| Year | Full Reference | Map Location |
|---|---|---|
| 2015 | Kroeger, K.F.; Plaza-Faverola, A.; Barnes, P.M.; Pecher, I.A. Thermal evolution of the New Zealand Hikurangi subduction margin: Impact on natural gas generation and methane hydrate formation–A model study. Marine and Petroleum Geology 2015, 63, 97–114. [2] | 1. New Zealand (Pegasus Basin) |
| 2016 | Fujii, T.; Tin Aung, T.; Wada, N.; Komatsu, Y.; Suzuki, K.; Ukita, T.; Wygrala, B.; Fuchs, T.; Rottke, W.; Egawa, K. Modeling gas hydrate petroleum systems of the Pleistocene turbiditic sedimentary sequences of the Daini-Atsumi area, eastern Nankai Trough, Japan. Interpretation 2016, 4, SA95–SA111. [6] | 2. Japan (Nankai Trough) |
| 2016 | Piñero, E.; Hensen, C.; Haeckel, M.; Rottke, W.; Fuchs, T.; Wallmann, K. 3-D numerical modelling of methane hydrate accumulations using PetroMod. Marine and Petroleum Geology 2016, 71, 288–295. [3] | N/A (Theoretical layer-cake model) |
| 2017 | Burwicz, E.; Reichel, T.; Wallmann, K.; Rottke, W.; Haeckel, M.; Hensen, C. 3-D basin-scale reconstruction of natural gas hydrate system of the Green Canyon, Gulf of Mexico. Geochemistry, Geophysics, Geosystems 2017, 18, 1959–1985. [7] | 3. Gulf of Mexico (Green Canyon) |
| 2017 | Crutchley, G.J.; Kroeger, K.F.; Pecher, I.A.; Mountjoy, J.J.; Gorman, A.R. Gas hydrate formation amid submarine canyon incision: investigations from New Zealand’s Hikurangi subduction margin. Geochemistry, Geophysics, Geosystems 2017, 18, 4299–4316. [8] | 4. New Zealand (Hikurangi margin) |
| 2017 | Kroeger, K.F.; Crutchley, G.J.; Hill, M.G.; Pecher, I.A. Potential for gas hydrate formation at the northwest New Zealand shelf margin—New insights from seismic reflection data and petroleum systems modelling. Marine and Petroleum Geology 2017, 83, 215–230. [9] | 5. New Zealand (Taranaki Basin) |
| 2019 | Kroeger, K.F.; Crutchley, G.J.; Kellett, R.; Barnes, P.M. A 3-D Model of Gas Generation, Migration, and Gas Hydrate Formation at a Young Convergent Margin (Hikurangi Margin, New Zealand). Geochemistry, Geophysics, Geosystems 2019, 20, 5126–5147. [10] | 6. New Zealand (Pegasus Basin) |
| 2020 | Sun, L.; Wang, X.; He, M.; Jin, J.; Li, J.; Yuanping, L.; Zhu, Z.; Zhang, G. Thermogenic gas controls high saturation gas hydrate distribution in the Pearl River Mouth Basin: Evidence from numerical modeling and seismic anomalies. Ore Geology Reviews 2020, 127, 103846. [11] | 7. China (Pearl River Mouth Basin) |
Table 2.
Basic metadata of the modelling studies surveyed but lacking TOC and/or HI values.
| Year | Full Reference | Map Location |
|---|---|---|
| 2013 | Haeckel, M.; Piñero, E.; Rottke, W.; Fuchs, T.; Hensen, C.; Wallmann, K. 3-D numerical modelling of gas hydrate accumulations at the Alaska North Slope. In 75th EAGE Conference & Exhibition-Workshops, European Association of Geoscientists & Engineers, June 2013. [12] | A. Alaska North Slope |
| 2018 | Hillman, J.I.; Burwicz, E.; Zander, T.; Bialas, J.; Klaucke, I.; Feldman, H.; Drexler, T.; Awwiller, D. Investigating a gas hydrate system in apparent disequilibrium in the Danube Fan, Black Sea. Earth and Planetary Science Letters 2018, 502, 1–11. [13] | B. Black Sea |
| 2018 | Su, P.; Liang, J.; Peng, J.; Zhang, W.; Xu, J. Petroleum systems modeling on gas hydrate of the first experimental exploitation region in the Shenhu area, northern South China sea. Journal of Asian Earth Sciences 2018, 168, 57–76. [14] | China (Pearl River Mouth Basin) |
| 2020 | Burton, Z.F.M.; Kroeger, K.F.; Hosford Scheirer, A.; Seol, Y.; Burgreen-Chan, B.; Graham, S.A. Tectonic uplift destabilizes subsea gas hydrate: A model example from Hikurangi Margin, New Zealand. Geophysical Research Letters 2020, 47, e2020GL087150. [15] | New Zealand (Hikurangi margin) |
| 2020 | Hillman, J.I.; Crutchley, G.J.; Kroeger, K.F. Investigating the role of faults in fluid migration and gas hydrate formation along the southern Hikurangi Margin, New Zealand. Marine Geophysical Research 2020, 41, 1–19. [16] | New Zealand (Hikurangi margin) |
Table 3.
Sediment organic contents used in the modelling studies surveyed.
| Reference | Location | Sediment Age | TOC (wt.%) | HI |
|---|---|---|---|---|
| Kroeger et al., 2015 [2] | New Zealand (Pegasus Basin) | Miocene to Recent | 0.5 (conservative) 1.0 | 100 |
| Fujii et al., 2016 [6] | Japan (Nankai Trough) | 1.5 to 0 Ma | 0.5 | 60 |
| Piñero et al., 2016 [3] | Theoretical layer-cake model | 2.5 to 0 Ma | 2.5 | 240 |
| Burwicz et al., 2017 [7] | Gulf of Mexico (Green Canyon) | Pliocene and Pleistocene | 0.7 (conservative) 1.0 (most realistic) | 100 |
| Crutchley et al., 2017 [8] | New Zealand (Hikurangi margin) | Miocene to Recent | 0.5 | 100 |
| Kroeger et al., 2017 [9] | New Zealand (Taranaki Basin) | Miocene to Recent | 0.5 | 100 |
| Kroeger et al., 2019 [10] | New Zealand (Pegasus Basin) | Neogene | 0.5 1.0 | 100 |
| Sun et al., 2020 [11] | China (Pearl River Mouth Basin) | Quaternary and older | 0.5 1.0 | ? |
Publisher’s Note: MDPI stays neutral with regard to jurisdictional claims in published maps and institutional affiliations. |
© 2022 by the author. Licensee MDPI, Basel, Switzerland. This article is an open access article distributed under the terms and conditions of the Creative Commons Attribution (CC BY) license (https://creativecommons.org/licenses/by/4.0/).
Share and Cite
MDPI and ACS Style
Burton, Z.F.M. Sediment Organic Contents Required for Gas Hydrate Formation: A Survey of Published Basin and Hydrocarbon System Models. Fuels 2022, 3, 580-587. https://doi.org/10.3390/fuels3040035
AMA Style
Burton ZFM. Sediment Organic Contents Required for Gas Hydrate Formation: A Survey of Published Basin and Hydrocarbon System Models. Fuels. 2022; 3(4):580-587. https://doi.org/10.3390/fuels3040035
Chicago/Turabian StyleBurton, Zachary F. M. 2022. "Sediment Organic Contents Required for Gas Hydrate Formation: A Survey of Published Basin and Hydrocarbon System Models" Fuels 3, no. 4: 580-587. https://doi.org/10.3390/fuels3040035